How to Use Google Data Studio to Create SEO Dashboards
Last updated on Saturday, October 14, 2023
Running a successful SEO campaign doesn’t stop at creating great content. The key to SEO is leveraging data to make important campaign decisions.
Why? SEO is a long game. And knowing how to optimize your website and improve your online presence is challenging without access to the right data to support these decisions.
That’s where Google Data Studio (now Looker Studio) comes into play. Google Data Studio is a reporting tool within the Google Marketing Platform that allows users to create custom dashboards to display analytics from various data sources.
Think of it as a business intelligence tool ideal for digital marketers, agencies, and business owners who want to create their own SEO dashboards.
In this guide, we’ll explain how you can use Google Data Studio to create SEO dashboards to unlock the power of your data and improve your campaign performance tenfold.
What is SEO Reporting?
SEO reporting isn't a collection of data points you store in Google Sheets for safekeeping. Rather, it's the backbone of your entire SEO strategy.
Think of it as a roadmap that indicates where you've been, where you are, and where you're headed regarding search engine performance.
Most digital marketers create SEO reports to present to external stakeholders, team members, and clients to:
- Show the progress of an SEO campaign via conversion rate
- Gauge whether a campaign is generating positive return on investment (ROI)
Hold themselves accountable for campaign performance
In other words, SEO reporting is the crux of any successful campaign. With advanced data and analytics in your back pocket, you can make smarter decisions.
What KPIs Should You Include in Your SEO Dashboard?
Key performance indicators (KPIs) are measurable values that show how effective your team is at achieving its business goals or targets.
They serve as a guide to help you focus your attention on what matters most.
For example, if your goal is to increase traffic to your website, you might focus on these main KPIs:
- Website sessions/visits: The total number of times someone visits your website during a given period.
- Unique visitors: The number of distinct individuals who visited your site, which provides a clearer picture of your site's reach.
Pageviews: The total number of individual pages viewed over the same period.
Of course, there are other metrics you might want to keep an eye on to fully understand your performance. Thankfully, with Google Data Studio, you can easily add all the KPIs that matter most to your campaign goals.
Here are the most common KPIs to include in your SEO dashboard:
Impressions
An impression happens when someone interacts with your ad, landing page, or website. The level of interaction can vary, from scrolling past an ad to staying on a landing page for a while.
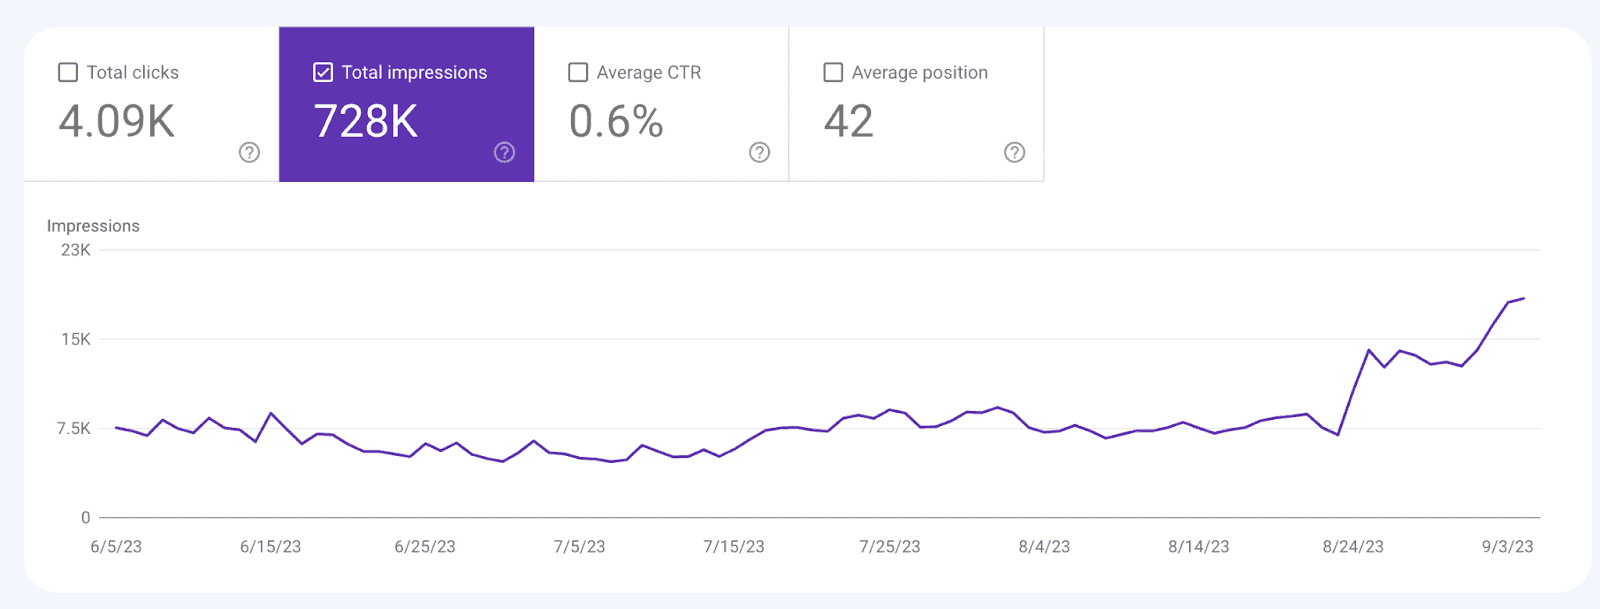
In Marketing 101, you might learn that impressions are one of the most basic marketing analytics. And while some marketers are quick to write off impressions as a vanity metric, they’re quite useful in observing how popular your content is.
Thus, adding this KPI to your SEO dashboard can give you a great idea of how your target audience interacts with your current campaign.
Keywords
Think of keywords as the exact terms that your target audience is typing into the Google search bar (or any other search engine).
In other words, keywords are search terms people use to find information online. And the whole idea behind SEO is choosing the right keywords that pertain to your products and services and ranking for them.
The higher you rank, the more visible you are to potential buyers.
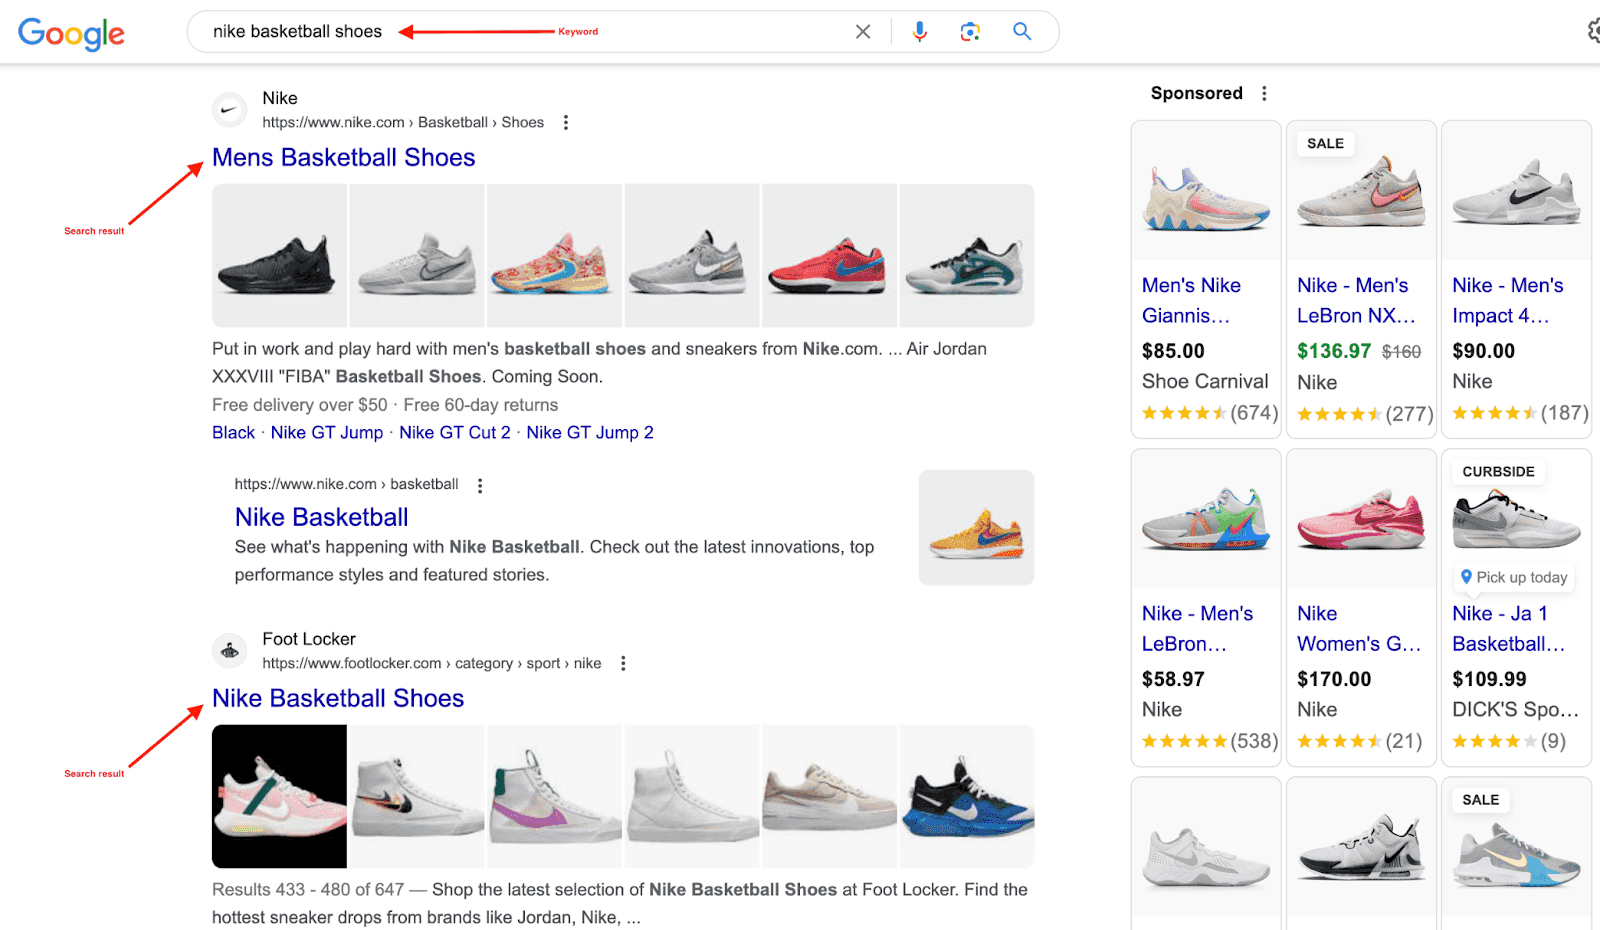
For this reason, keyword data is an important KPI to add to your SEO dashboard. Here's a short list of key keyword data to watch:
Search volume: The total volume of searches for that word or phrase within the past 30 days.
Keyword ranking: Where your website appears in search engine results for a particular keyword.
Keyword difficulty: An estimate of how challenging it is to organically rank for a specific term.

Average position
Did you know that the first page of Google captures at least 71% of all web traffic?
The higher you appear on Google’s search engine results page (SERP), the more traffic you can generate to your site. And the average position is a metric that helps you understand where you appear in those search results.
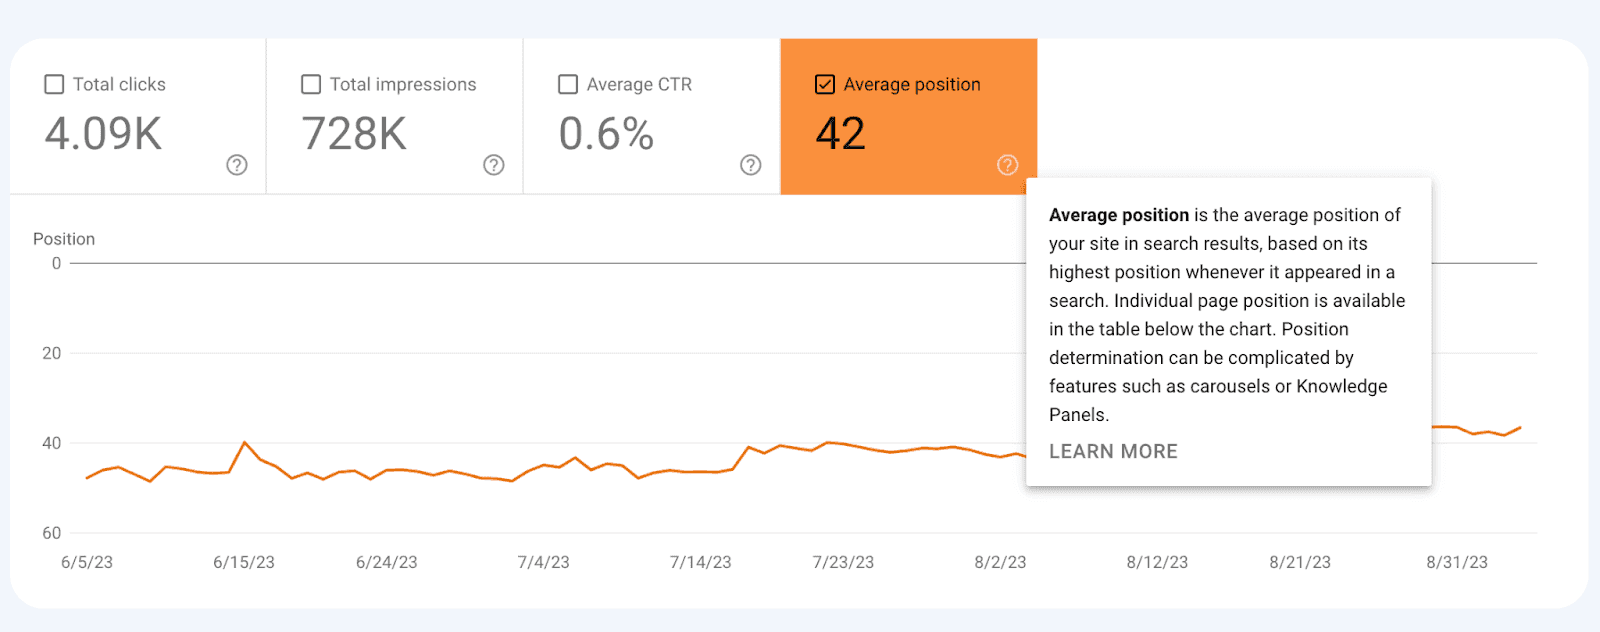
If you want to measure the progress and growth of your SEO campaign, then you should include this metric in your SEO dashboard.

Ideally, you’ll want your average position to land somewhere between 1–4 on the SERPs. That way, you can ensure that your target audience can find your website.
You can also compare different types of content, like blog posts or landing pages, to see what resonates best for your audience. However, creating high-quality content can be a complex and time-consuming process, especially if you don’t have the skills or resources to do it yourself.
So, if writing isn’t your forte (or you notice that your content is ranking as well as you hoped), you can always outsource the process and hire a blog writer. A professional blog writer can help you save time, increase authority, and boost your SEO rankings with well-written and optimized blog posts.
The result? Content that your audience loves. You can outrank your competition. And you can spend more time on tasks that suit your skill sets. It’s a win-win-win.
Total clicks
Total clicks are all the clicks your campaign accumulates during your set period. Whether the click was relevant to your campaign or not, it'll still count toward the overall metric.
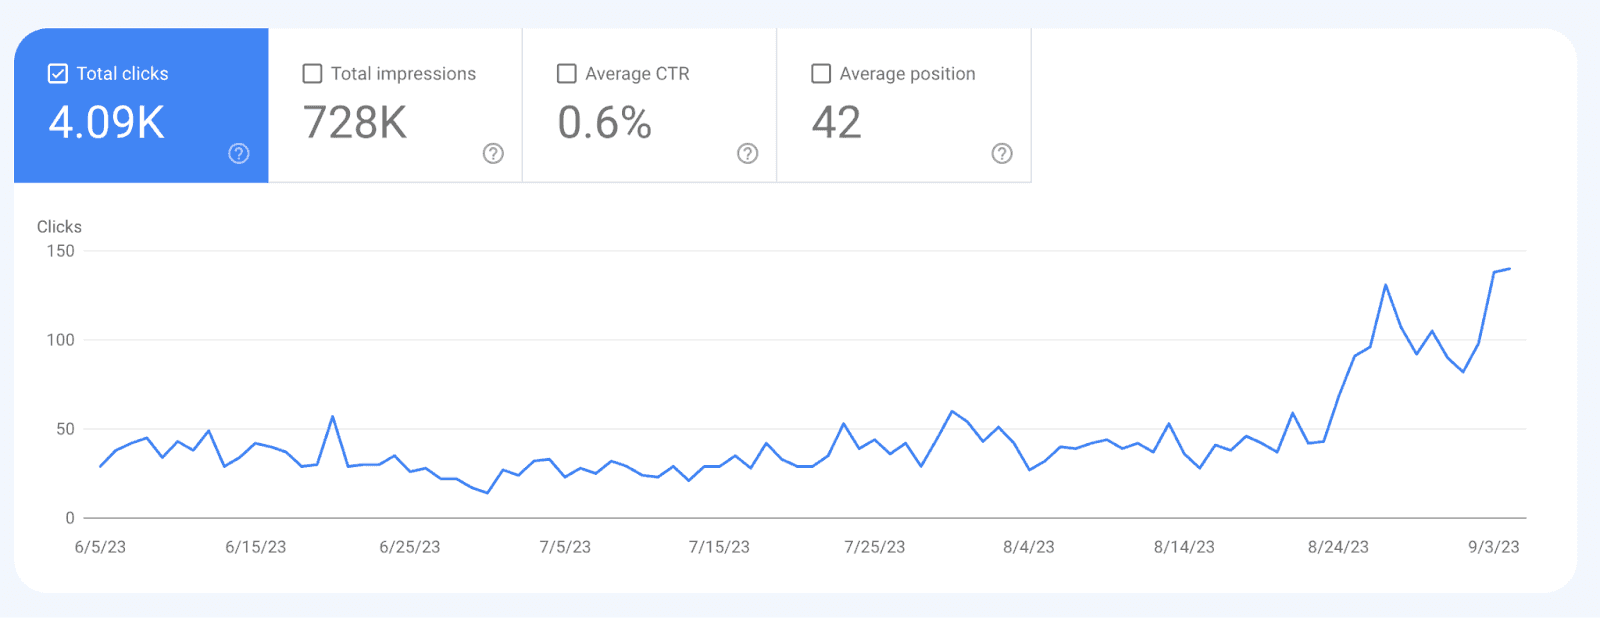
Why are clicks helpful to see on your SEO dashboard?
When a user clicks on your webpage from search results, it indicates that they found your listing relevant to their query. More clicks suggest that your meta title and description are enticing and match user intent.
Often, pages that receive more clicks might be rewarded with better rankings. Why? Search engines interpret higher clicks as a sign of relevance and quality, boosting trust signals for your site.
Click-through rate
The click-through rate (CTR), which is the ratio of clicks to impressions, sheds light on how compelling your site appears in search results.
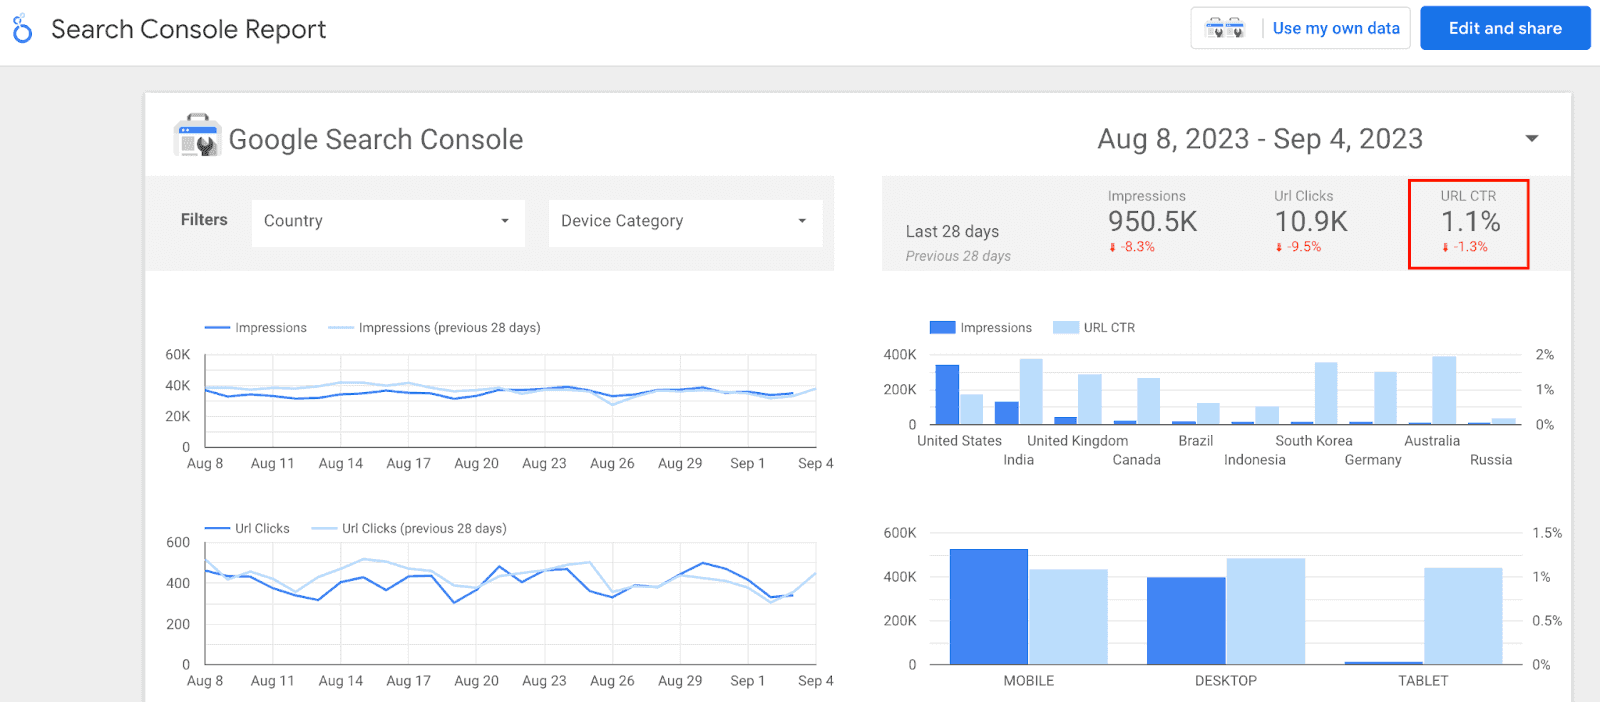
A lower-than-expected CTR, even with high rankings, might indicate that your title or meta description needs some tweaking.
Country
Whether you run a domestic or international company, you should add this metric to your SEO dashboard.
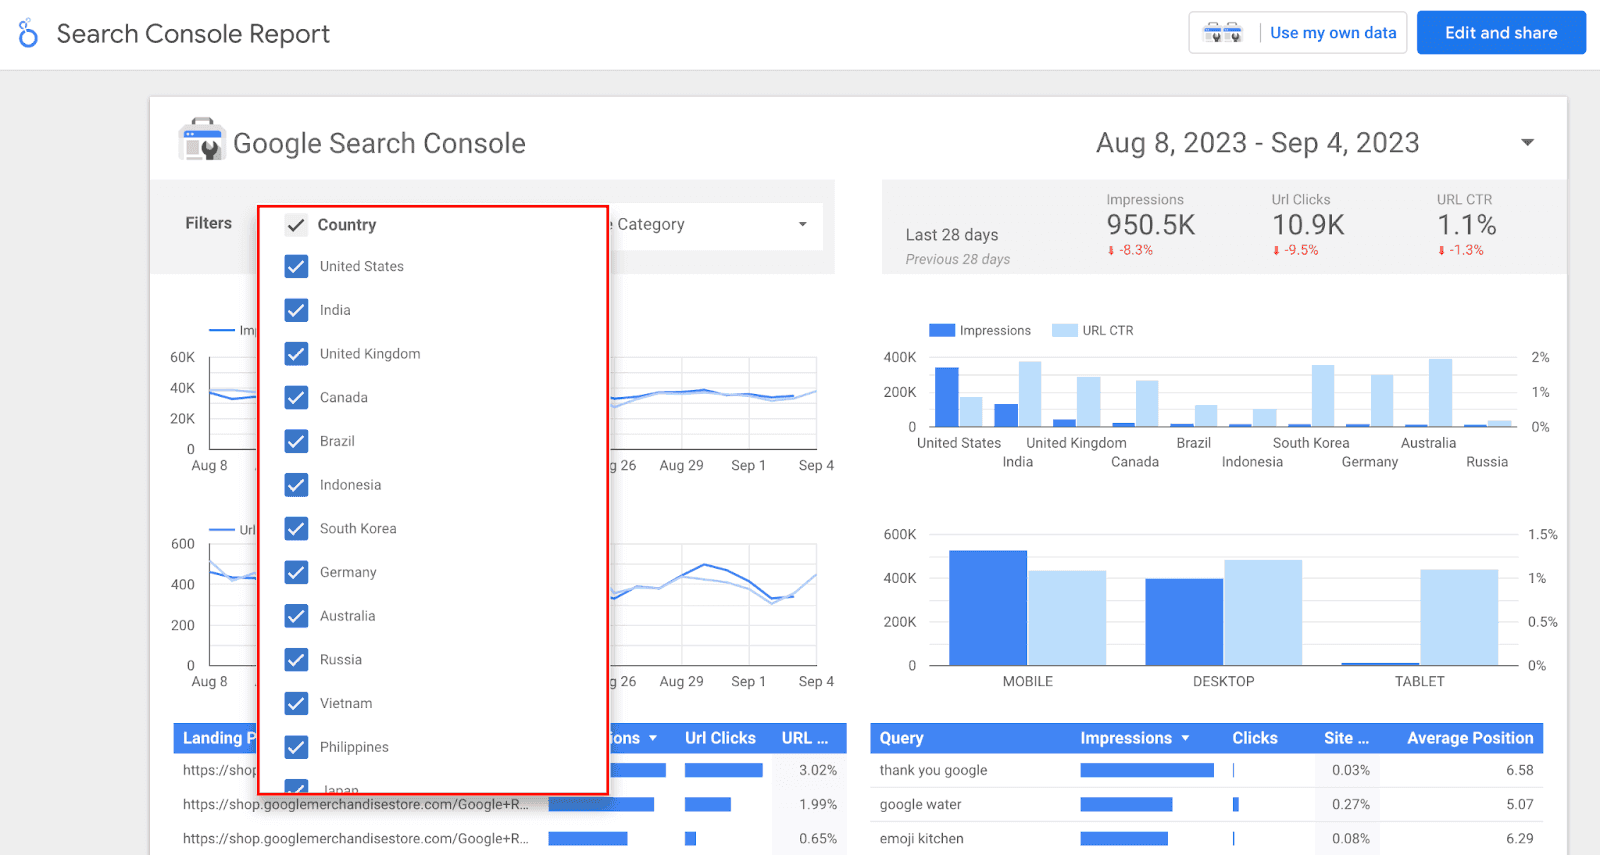
Why? Location data can help you:
Pinpoint where your website's traffic is predominantly coming from
Identify your top-performing countries to help guide local SEO strategies
Allocate budgets and resources to the most engaged regions
Device Type
Finally, device type is a valuable metric for seeing how your target audience is interacting with your content, whether it’s from a desktop computer or a smartphone.
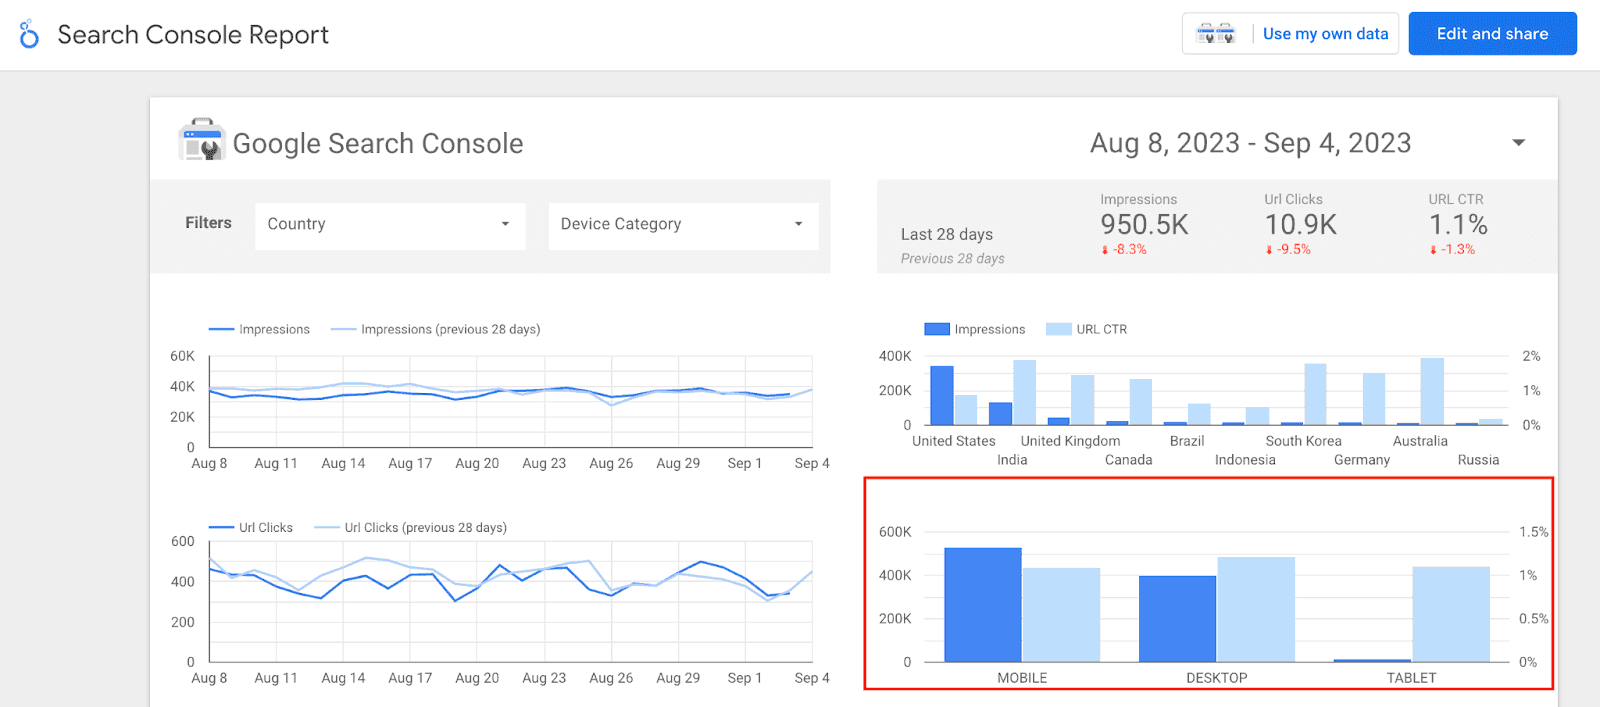
Studies show that most internet usage comes from mobile devices. Still, it’s wise to understand how your target audience prefers to consume information. That way, you can guarantee that you’re providing the best possible user experience.
The better the user experience, the less likely your audience will bounce. And lower bounce rates send positive trust signals to Google, helping boost your chances of ranking higher.
Helpful tips for using Google Data Studio
Now that you know which KPIs to include in your SEO dashboard, the next step is setting up these metrics with Google Data Studio’s interface (Looker Studio).
Here are some helpful tips that'll teach you not only how to use this tool but also how to position your SEO campaign for success.
Connect different data sources
Analytics don’t just come from thin air. They’re derived from data sources that natively track the data you’re looking for.
Earlier, we discussed all the KPIs you should include in your SEO dashboard. So, to track all of these valuable metrics, you’ll need to connect to a data source first.
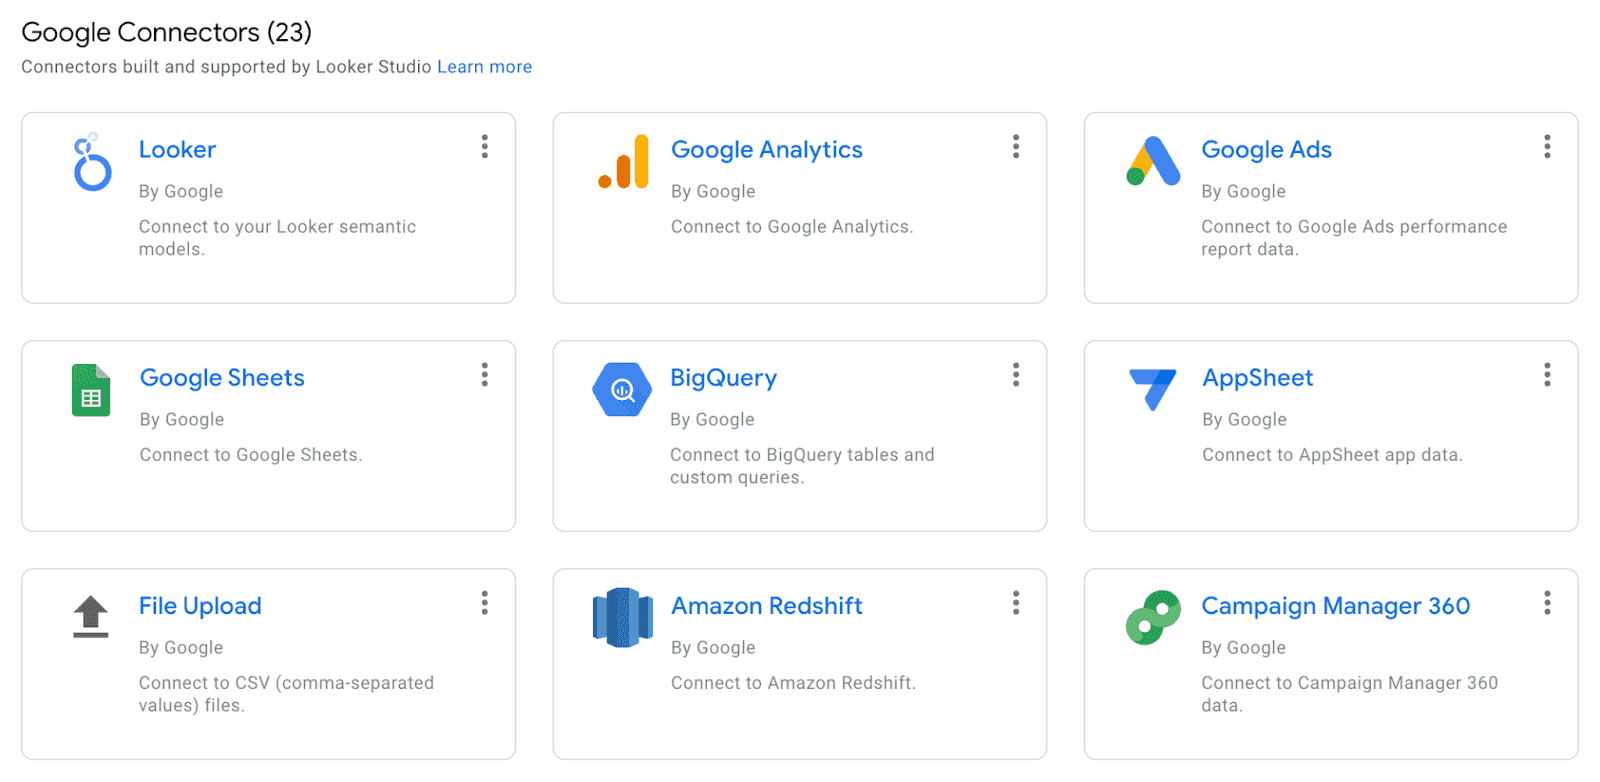
Thankfully, Looker Studio gives you access to 23 different “Connectors” (built and supported by Google). These include Google Analytics, Google Search Console, Google Sheets, and Google Ads.
As Google’s premier webmaster tool, Google Search Console allows you to pull in all your data to manage the technical side of your SEO campaign.
Google Analytics is another must-have in the Google suite of tools to measure your campaign’s growth and pull in important metrics like bounce rate and dwell time.
Google also offers 833 “Partner Connectors” to take advantage of real-time SEO reporting. For instance, you can add the Ahrefs site audit tool to learn more about your website’s SEO health.
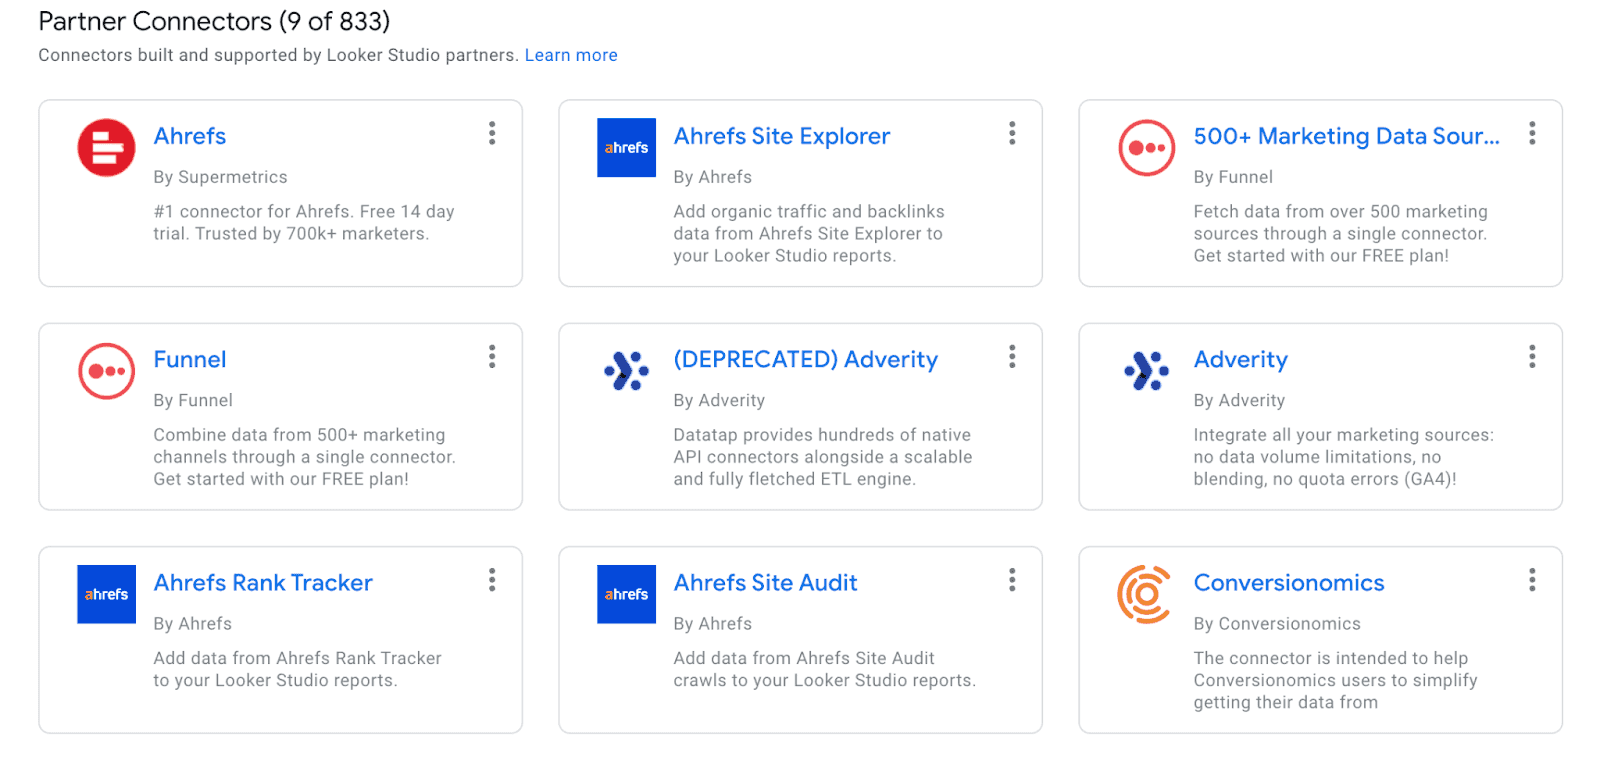
Or you can create a data source to Semrush, a keyword research tool to add search terms to your campaign. You can also use Semrush to gauge your competitive landscape and figure out ways to surpass your competition in the SERPs.
Connecting these data sources pulls in all of your important data in one place to create a single source of truth for your SEO team.
Create visualizations and charts
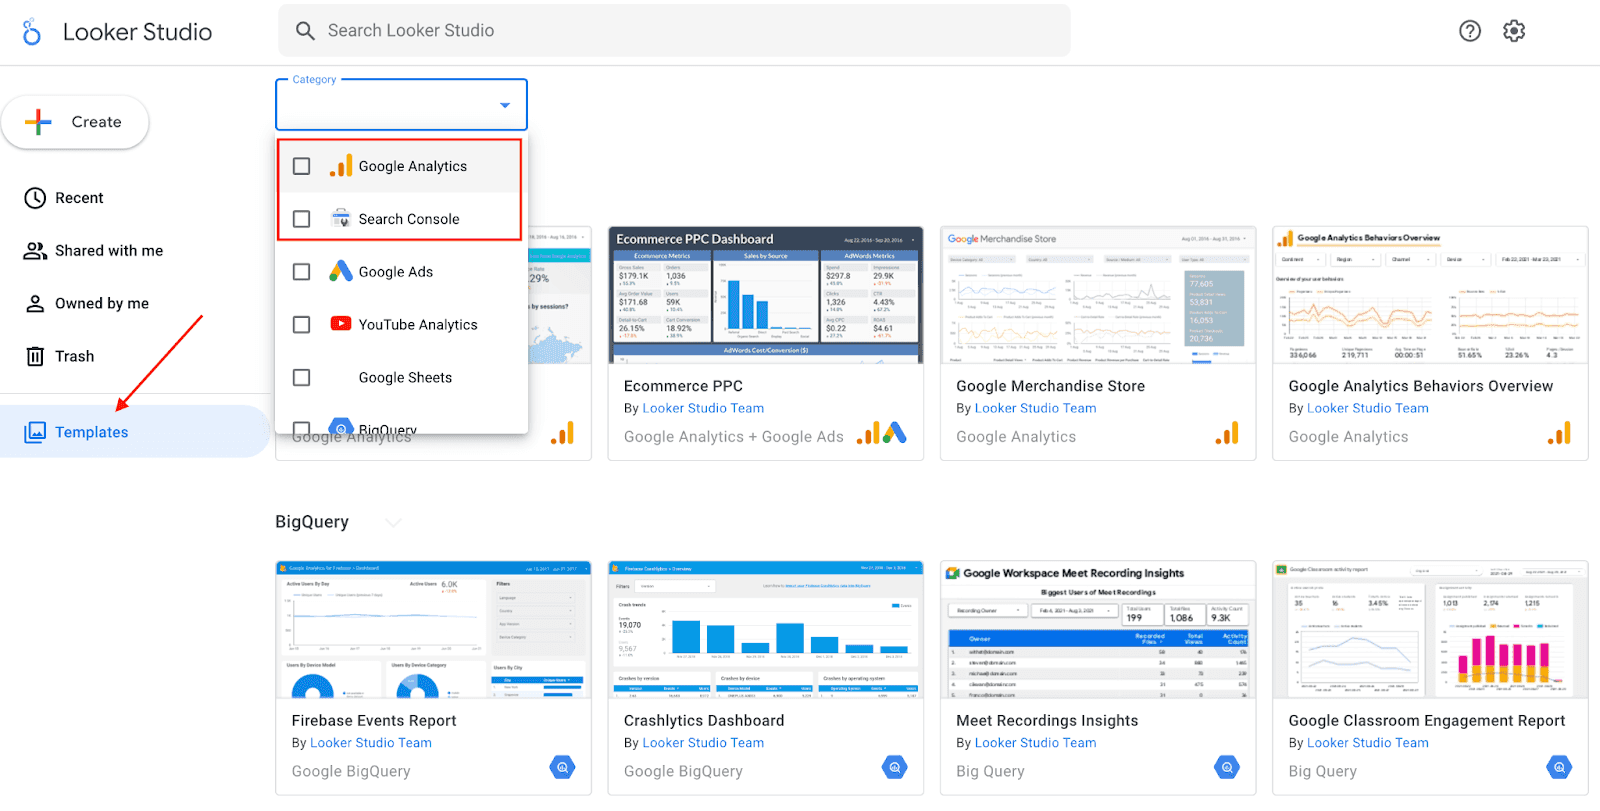
One of the greatest features of Google Data Studio is its design capabilities. Anyone can use this tool to design the front end of their SEO dashboard to take advantage of data storytelling.
For example, you can view charts instead of tables. This tool makes it simple for anyone to style their interactive dashboards according to the data sources and KPIs they’re tracking using pre-built dashboard templates.
Add a scorecard
Think of scorecards as the pulse checkers for your website performance.
They give you and your team a quick, digestible snapshot of how things are going — whether it's total impressions, the stickiness of your website measured by bounce rate, or average position.
In a single glance, scorecards let everyone on the team know if it's a high-five kind of day or if it's time to roll up those sleeves and dive into problem-solving.
Scorecards provide a concise snapshot of specific metrics. It offers an at-a-glance view of crucial performance indicators or other pivotal SEO measurements.
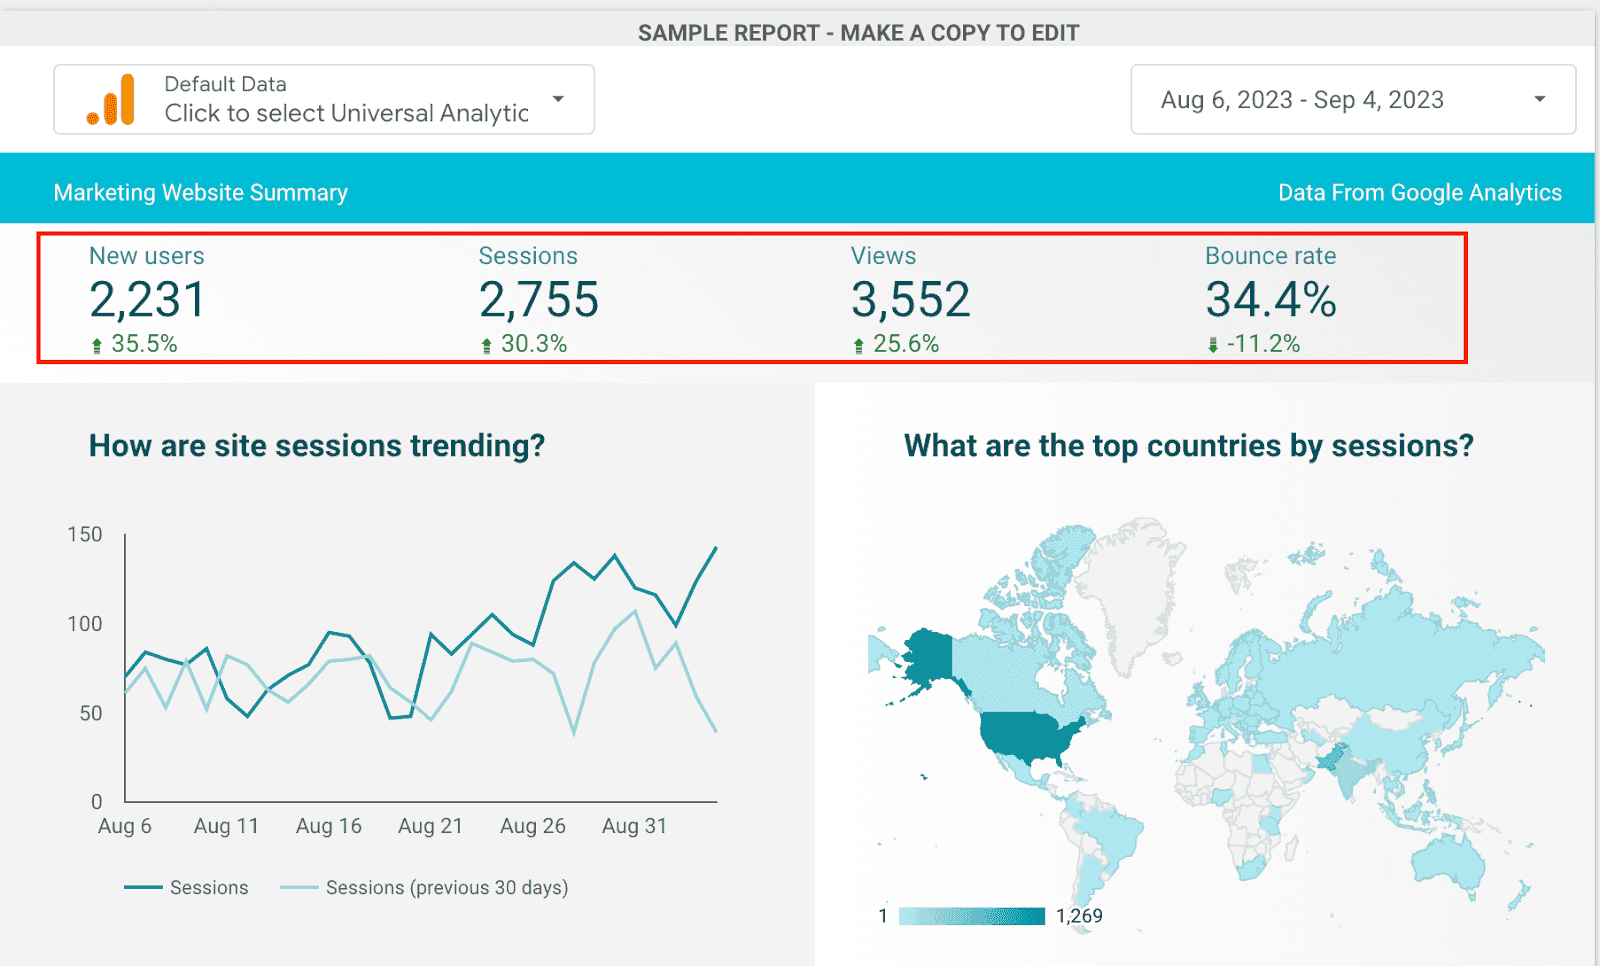
With scorecards, your team can swiftly grasp performance, facilitating faster decision-making and strategy adjustments.
Final Words
Google Data Studio is an amazing tool that allows you to create custom SEO dashboards from your favorite data sources.
Say goodbye to building static reports in Google Sheets and hello to real-time SEO reporting that helps you make better decisions to improve performance.
Now, over to you. How will you use Google Data Studio to kick your next SEO campaign into high gear?

Article by:
Juwaria
Freelance Writer
Juwaria is a freelance writer specializing in the fields of SaaS and marketing. Backed with 3+ years of experience, she helps brands build content that adds value to their business. In her free time, you can catch her reading her favorite books or studying the latest trends online.
