Forecasting
Getting StartedForecasting
What is Forecasting?
AccuRanker's forecasting tool helps you demonstrate the potential impact of your SEO efforts. Select your keywords and rank targets, and AccuRanker will calculate and visualize the results.
Rank targets are converted into traffic estimates using search volume and click-through rate (CTR). AccuRanker provides precise device-specific search volumes, accounting for keyword grouping with our proprietary AI Search Volume. Since no two SERPs are alike, AccuRanker also calculates CTR using more than 100 factors with our proprietary AI CTR.
With these traffic estimates, you can also calculate revenue, return-on-investment (ROI), and cost-per-acquisition (CPA) based on conversion rates, average conversion value, and investment costs. You can even set conversion rates by search intent — transactional keywords typically convert better than informational ones.
There are no limits on forecasts or keywords. Forecasts are calculated instantly, and progress is tracked in real-time.
Adding a Forecast
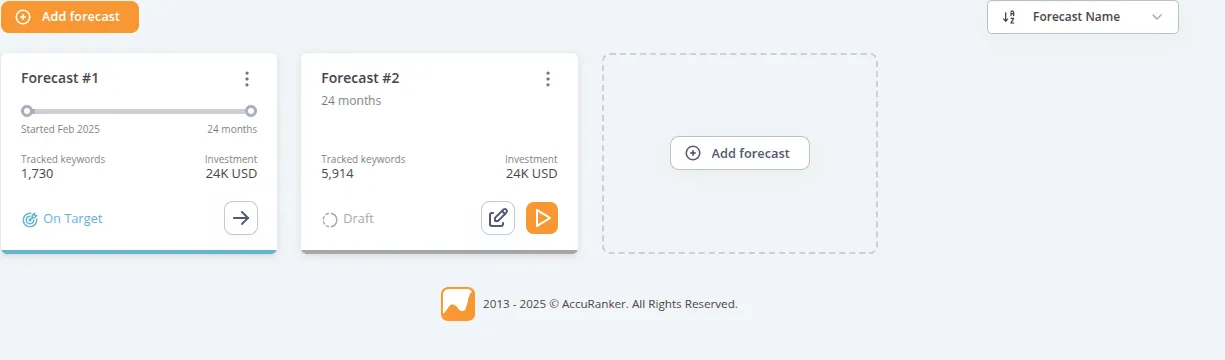
To add a forecast, go to the Forecasts tab and click Add forecast. A five-step wizard will guide you through the setup.
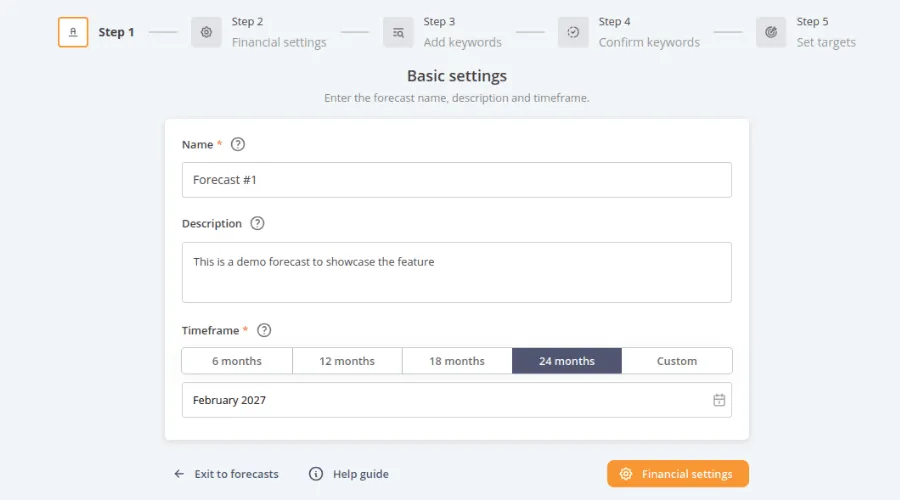
Step 1: Basic settings
Enter the forecast name, description, and timeframe. The name and description help you identify the forecast. The timeframe defines how long your SEO effort will continue until reaching the keyword targets. Once basic settings are submitted, the forecast is saved as a draft, so you can return to it at any step.
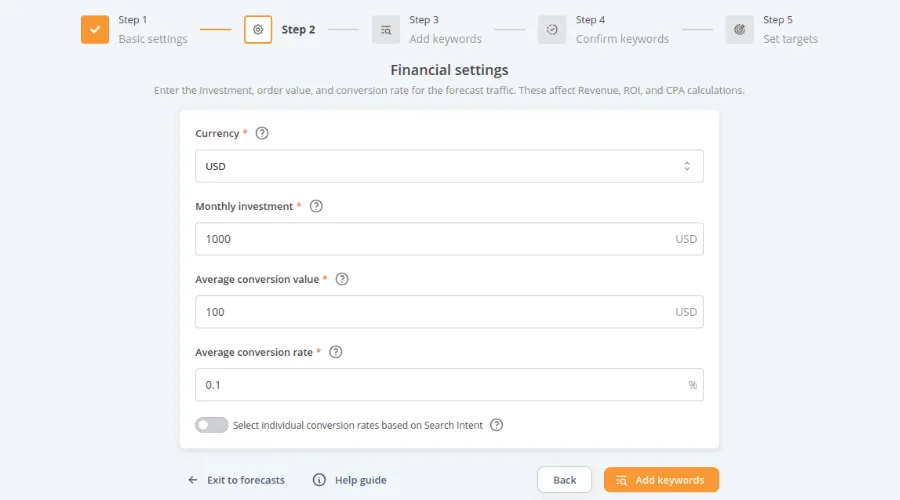
Step 2: Financial settings
Set financial parameters affecting revenue, ROI, and CPA. Enter your preferred currency (for display purposes), monthly investment, average conversion value and conversion rates. If unsure, you can keep the defaults and update them later.
These parameters outline both the cost and potential revenue of your SEO efforts. The cost is represented by the monthly investment. This can include costs like labor, tools, and other related expenses. The revenue is determined by two key factors: average conversion value (how much revenue each conversion generates) and average conversion rate (the percentage of visitors who complete a conversion such as a purchase).
Using tools like Google Analytics can help refine these estimates for greater accuracy.
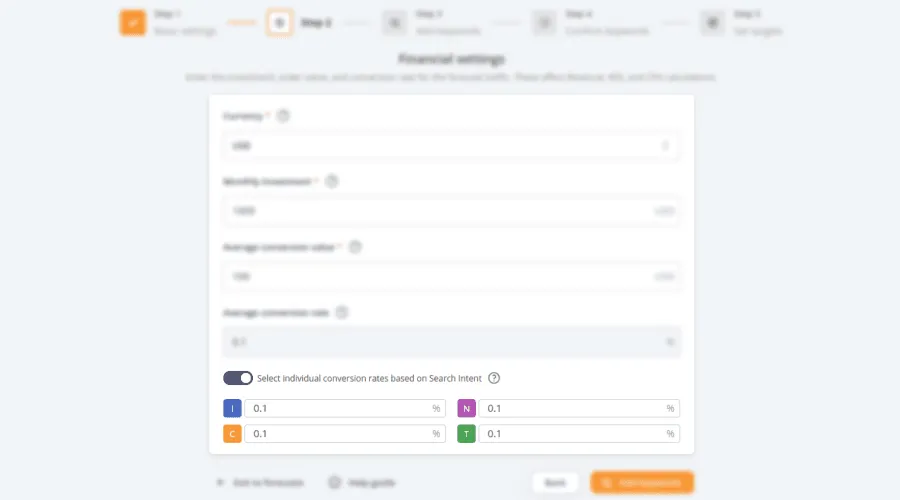
You can also toggle search intent-specific conversion rates.
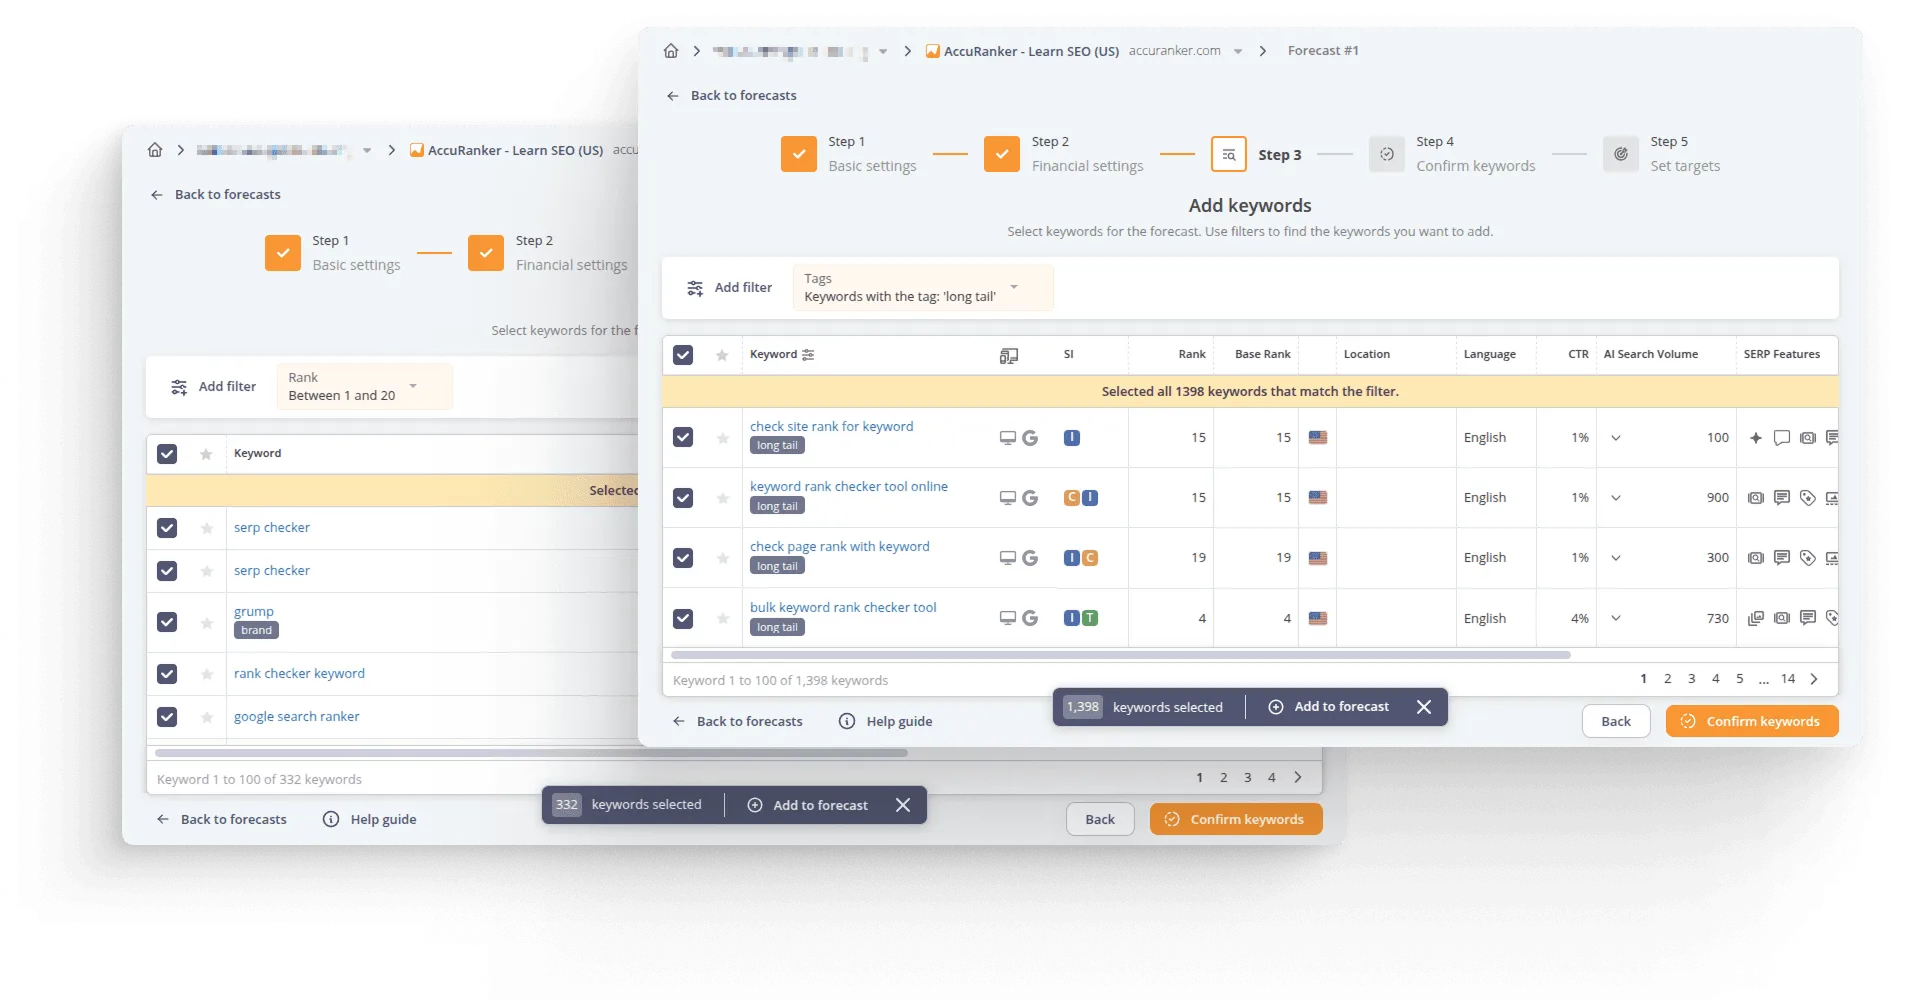
Step 3: Add keywords
Select the keywords to include in the forecast. A menu appears when you select keywords, allowing you to add them to the forecast.
The filter bar is available, giving you full flexibility to find the exact keywords you need, just like in the rest of the application.
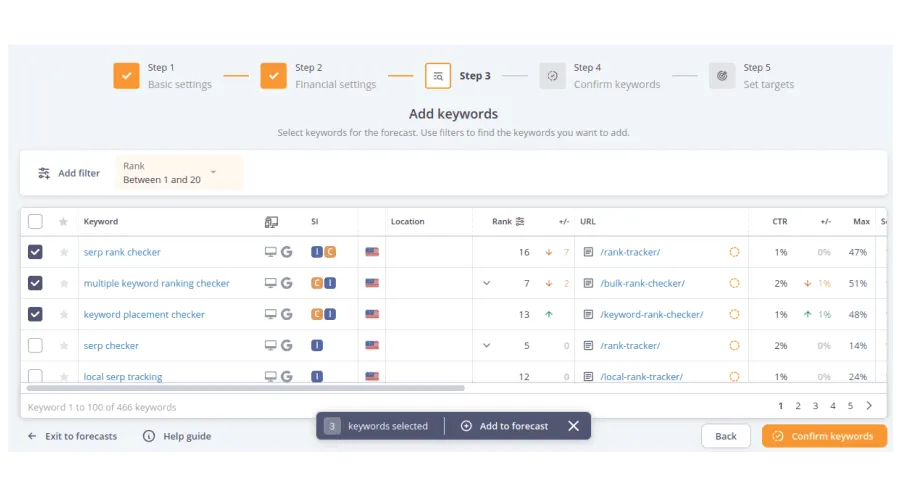
You can add keywords in multiple iterations. For example, you might first add keywords with a specific tag, then add those within a certain rank range.
Adding more keywords improves traffic estimates. If you later try to delete a keyword that’s part of a forecast, AccuRanker will issue a warning. To delete it, you must first remove it from the forecast. This prevents accidental changes that could affect the forecast.
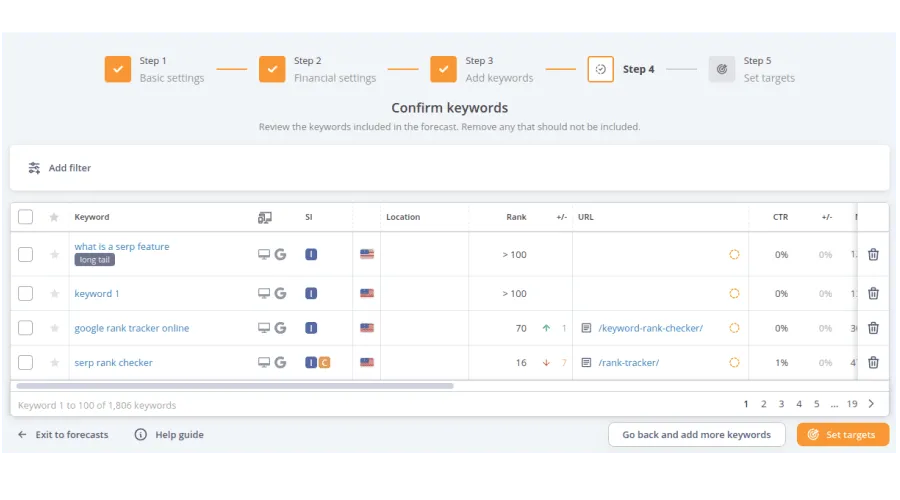
Step 4: Confirm keywords
Review your keyword selection and remove any unnecessary ones.
You can also use the filter bar to narrow your search and remove keywords in multiple iterations.
Step 5: Targets
In this final step, set keyword rank targets—the rank each keyword should reach by the end of the forecast timeframe.
As in previous steps, the filter bar helps you find specific keywords, and you can apply targets in multiple iterations.
Since you likely added many keywords, setting each target individually isn’t practical. Instead, you can set a target for all selected keywords at once.
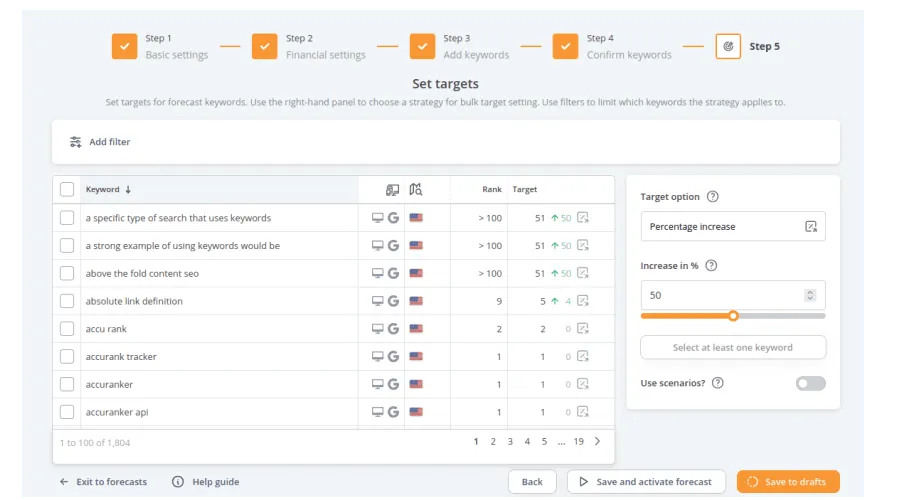
You have four target options to set the target for all keywords at once:
Move to rank
Set the target rank for the selected keywords.
Outrank competitor
Choose a competitor to surpass in rankings. The target rank will match the competitor's current rank.
Percentage increase
Set the percentage increase in rank.
100% moves the keywords to rank 1, while 0% means no change.
Rank increase
Set the number of positions the keywords should move up by.
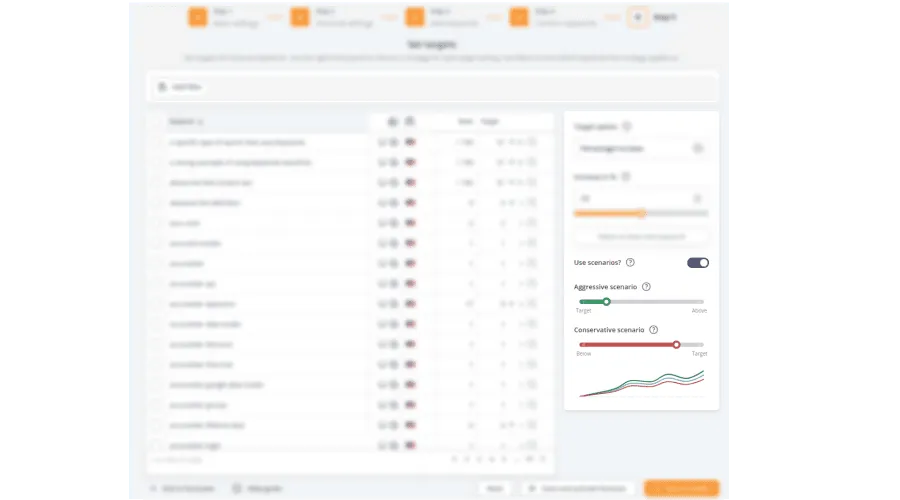
Forecasting always involves some uncertainty. To account for this, you can use alternative scenarios: aggressive and conservative. These adjust the target by a percentage and display the scenario alongside your main target.
For example, if the conservative scenario is set to 50%, it means reaching 50% of the target. If a keyword is set to move from rank 20 to 10, the conservative scenario would place it at rank 15 instead.
Likewise, if the aggressive scenario is set to 150%, it means exceeding the target by 50%, moving closer to rank 1. In the rank 20 to 10 example, the aggressive scenario would place the keyword at rank 5 instead.
You can adjust these values using the sliders. To disable scenarios, set them to 100% so they match your applied targets.
When you are done setting your targets, you can save and activate the forecast. If you want to revisit the targets later before activating, you can save the forecast as a draft.
In the forecast list, draft forecasts have two buttons: one to edit and one to activate. Activated forecasts have a button to open and examine their contents and progress.
The status indicator on an activated forecast shows whether performance is on target, below target, or above target. A forecast is considered on target if it is within a 5% margin of the projected outcome.
Viewing the Forecast
Once a forecast is activated, you can examine it through the different views. Each view presents key metrics in various formats, helping you track progress and compare different scenarios.
You can also track your actual progress against the forecast. Progress is displayed as the scenario in golden color. Progress is displayed on all views, except the summary and configuration views.
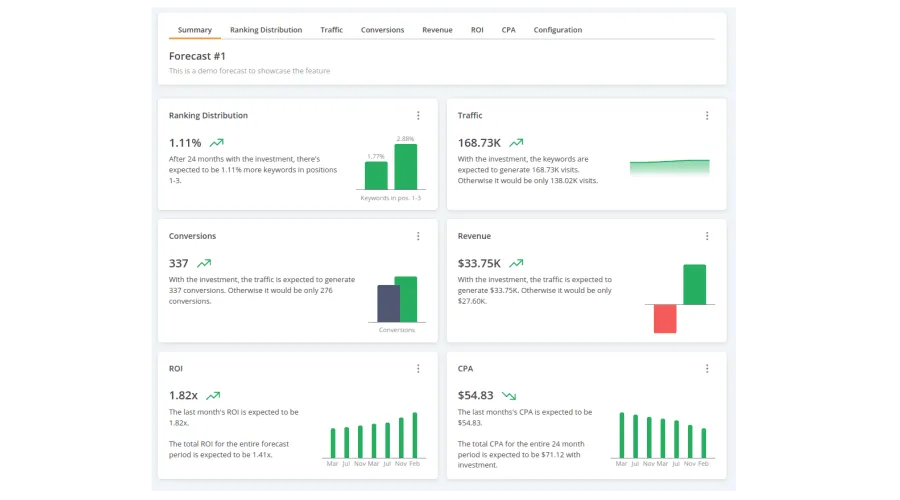
Summary View
The Summary view provides an overview of key forecast metrics, including ranking distribution, traffic, conversions, revenue, ROI, and CPA.
Each metric is compared to the expected outcome without the forecasted investment, showing the impact of your SEO efforts versus keeping all keywords at their current rank.
Graphs and trend indicators visualize changes and outcomes.
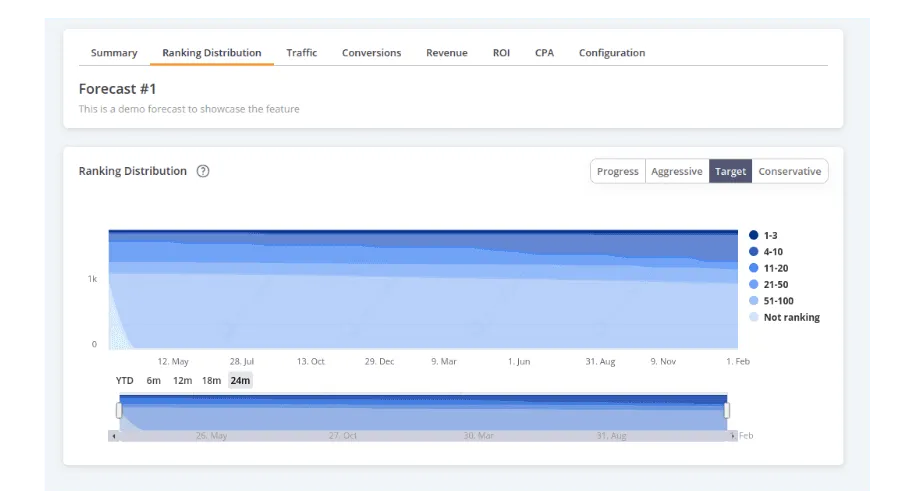
Ranking View
The Ranking view shows how keyword rankings are expected to evolve over time. The ranking distribution chart breaks down keywords into ranking brackets (e.g., positions 1-3, 4-10), allowing you to see how many keywords are projected to improve and by how much.
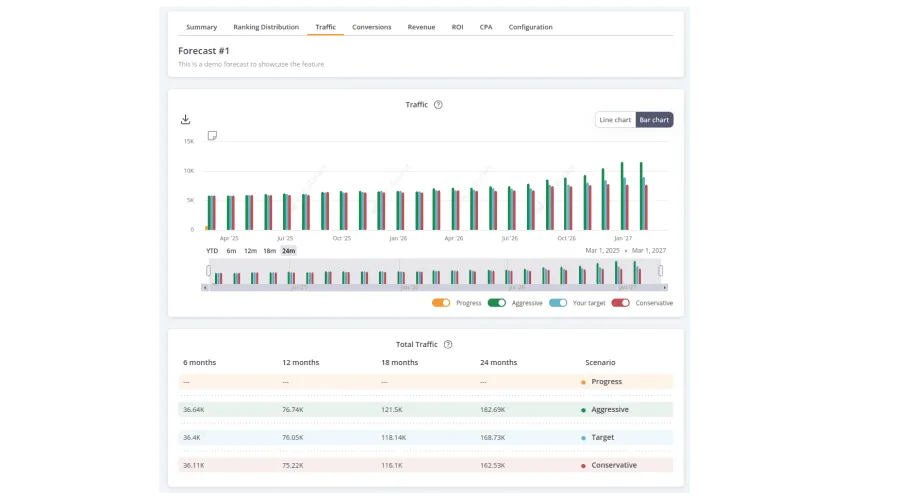
Forecast Views
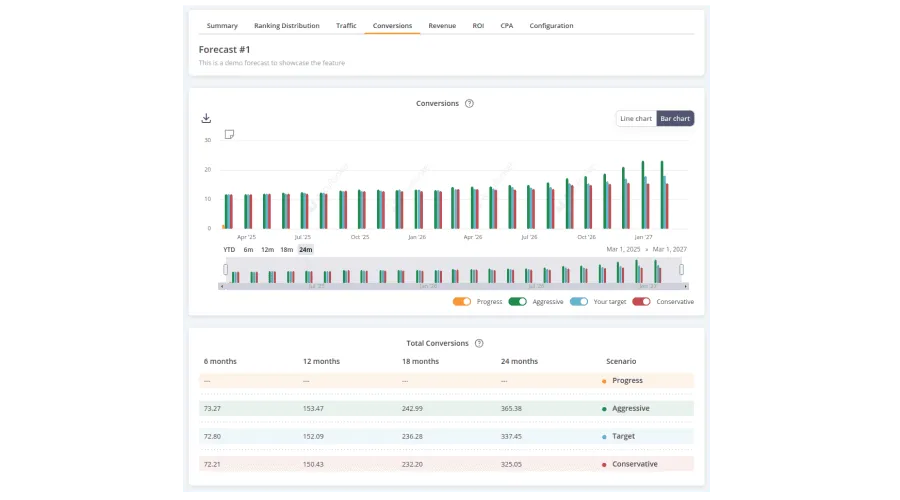
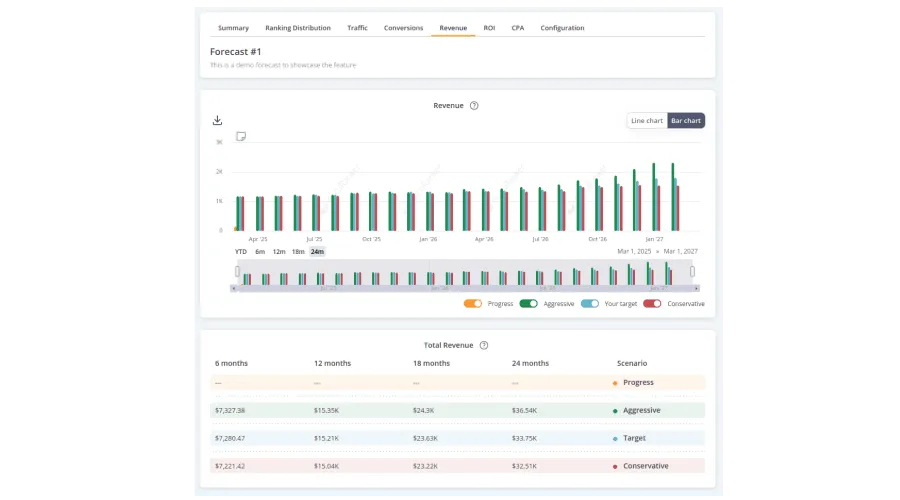
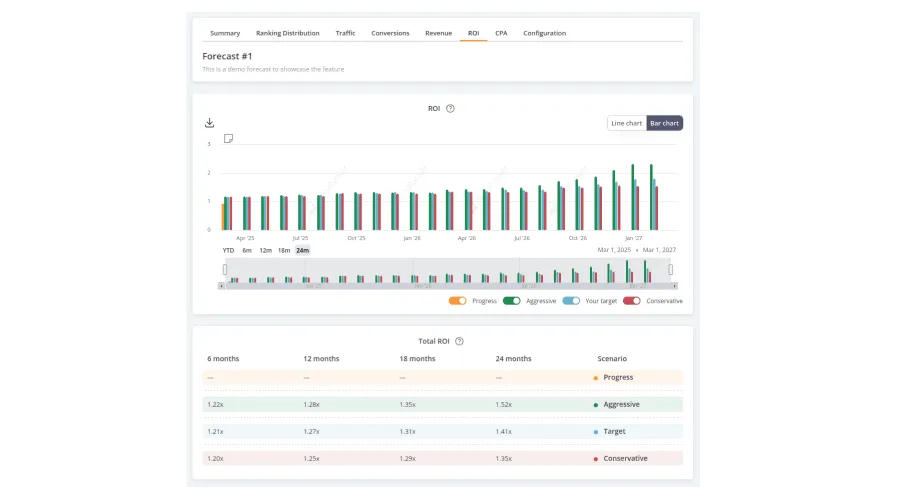
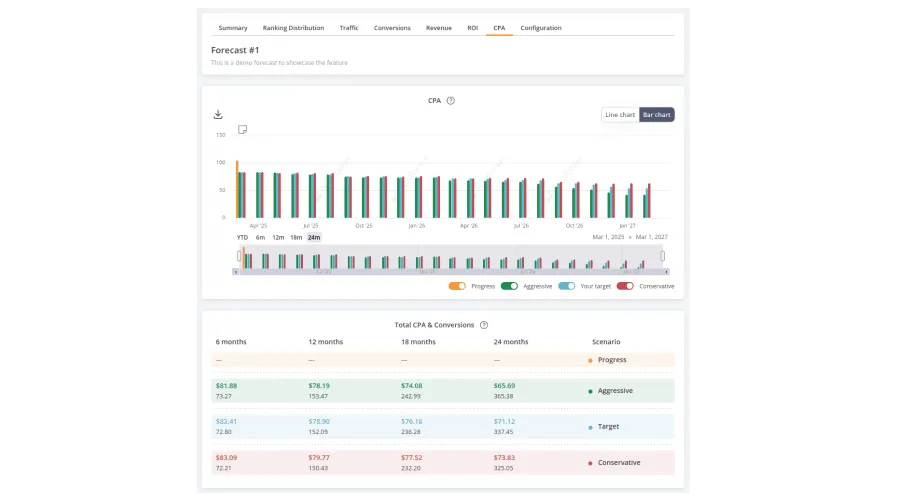
The following views presents key metrics through charts and summary tables. The charts show changes month by month, comparing different forecast scenarios, while also showing your actual progress in golden color. This helps you track how your SEO efforts align with expectations.
Below each chart, a summary table provides cumulative totals at key time intervals for each scenario. The number of months in the table depends on the forecast timeframe, but there will always be four segments, with the fourth showing the total cumulative values.
Traffic View
The Traffic view projects the number of visits generated by the forecasted keyword rankings. It shows how different ranking outcomes impact organic traffic.
Traffic is calculated as search volume × CTR, using AccuRanker's AI Search Volume and AI CTR. The search volume is based on data from the forecast's start date, while the CTR is determined by ranks and the SERP features present for each SERP at that time, assuming no changes in SERP composition.
Conversions View
The Conversions view projects the number of conversions based on traffic and conversion rates.
Conversions are calculated as traffic × conversion rate. If search intent-specific conversion rates were enabled, the calculation reflects this.
Revenue View
The Revenue view projects earnings from forecasted traffic and conversion rates. It helps estimate the financial impact of ranking improvements.
Revenue is calculated as conversions × average conversion value.
ROI View
The ROI (Return on Investment) view projects profitability by comparing revenue to investment costs. It helps assess whether the forecasted SEO effort is financially viable.
ROI is calculated as revenue / investment. To make progress comparable to the forecast, the progress scenario adjusts the current month's investment proportionally to the number of days left in the month.
CPA View
The CPA (Cost Per Acquisition) view estimates how much each conversion costs under different scenarios. It helps determine the efficiency of the SEO investment.
CPA is calculated as investment / conversions. Similar to revenue, for the progress scenario, the current month's investment is adjusted proportionally based on the number of days remaining in the month.
Editing the Forecast
When a forecast is used to secure buy-in for SEO investments or is part of a collaborative effort with multiple team members, it’s important that it doesn’t change unexpectedly. However, you may still need to make adjustments after activation.
AccuRanker strikes a balance by allowing edits while ensuring full transparency. To make changes to an active forecast, you must first convert it back to a draft. By requiring drafts for edits, you can be certain that no changes are made without clear intent, even when multiple team members are involved. Whenever a forecast is edited, a note is automatically created, logging that an adjustment was made along with the avatar of the user who made it.
Steps to Draft a Forecast
- Navigate to the forecast list in the platform.
- Locate the forecast you want to edit.
- Click the menu icon (e.g., three dots) next to the forecast.
- Select "Draft" from the menu.
- Confirm the message that appears
Once in draft mode, you can freely edit the forecast. When you're satisfied with your changes, reactivate it.
Still need help?
Customer support
Our live support team is ready to assist you with any issues.