AI Overview Page
OverviewMonitor your presence in AI Overviews
The AI Overview page is your hub for monitoring the AI Overviews and seeing how you appear in the AI Overviews.
Explore graphs, tables and charts designed to provide both quick and detailed information about AI Overviews for the keywords you track. You can download the content of any widgets by clicking the kebab menu (three vertical dots) in the top-right corner.
The following sections describe each widget:
Historical Keyword Count with AI Overview
The graph shows both the number of keywords with AI Overview and the number of keywords with AI Overview (Owned) over time. Here, owned is defined as your domain being part of one of the URLs in the AI Overview.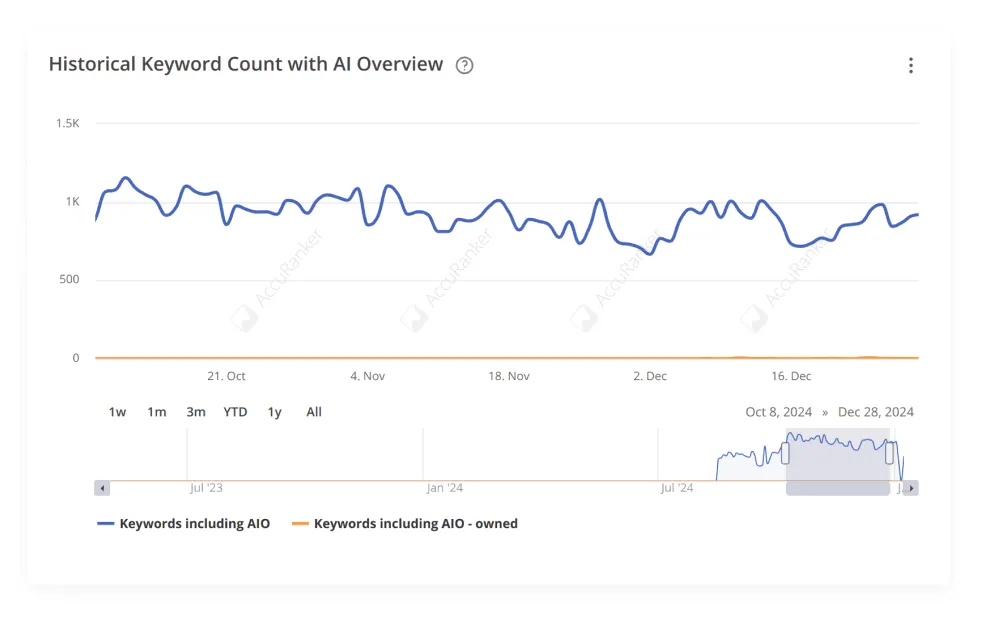
Distribution of URLs in AI Overviews
The histogram shows the distribution of the number of URLs contributing to each AI Overviews.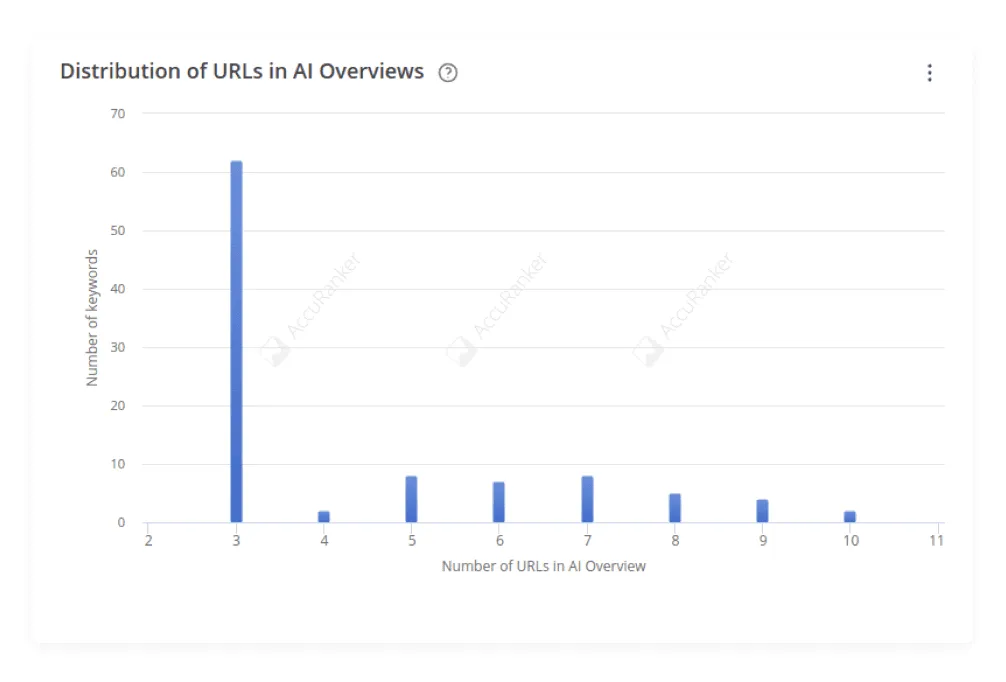
Top URLs
The table shows an aggregation of all URLs appearing in the AI Overviews, i.e. the frequency of each URL. Your own URLs (if you have any) are coloured orange.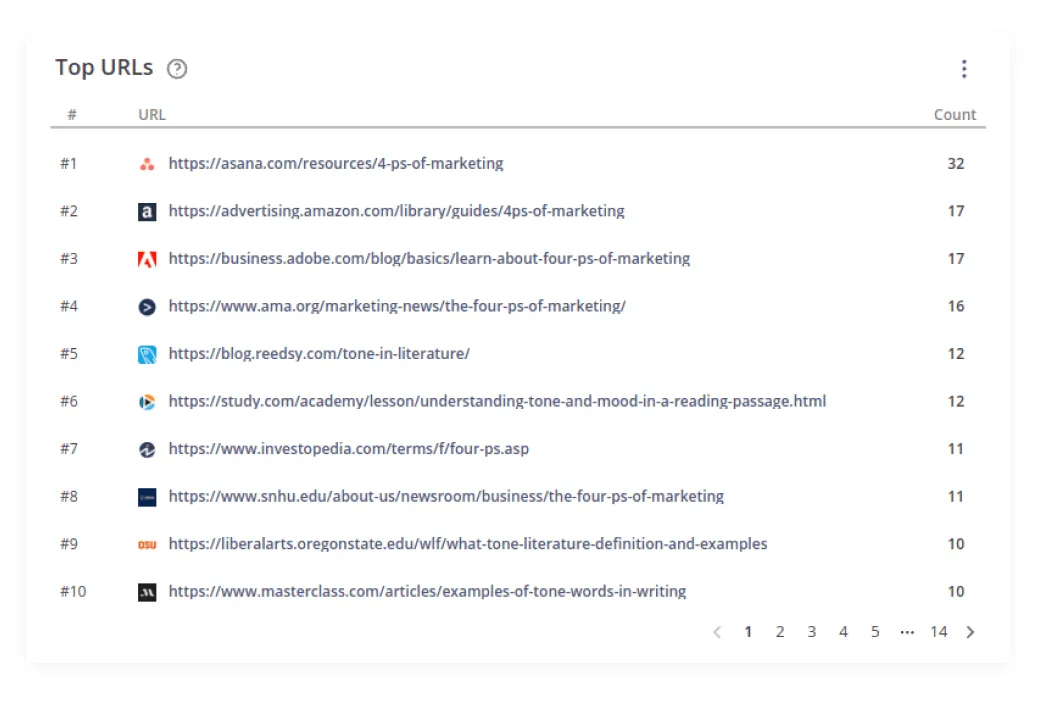
Top domains
The table shows an aggregation of all domains appearing in the AI Overviews, i.e. the frequency of each domain. Your own domain (if you have one) is coloured orange.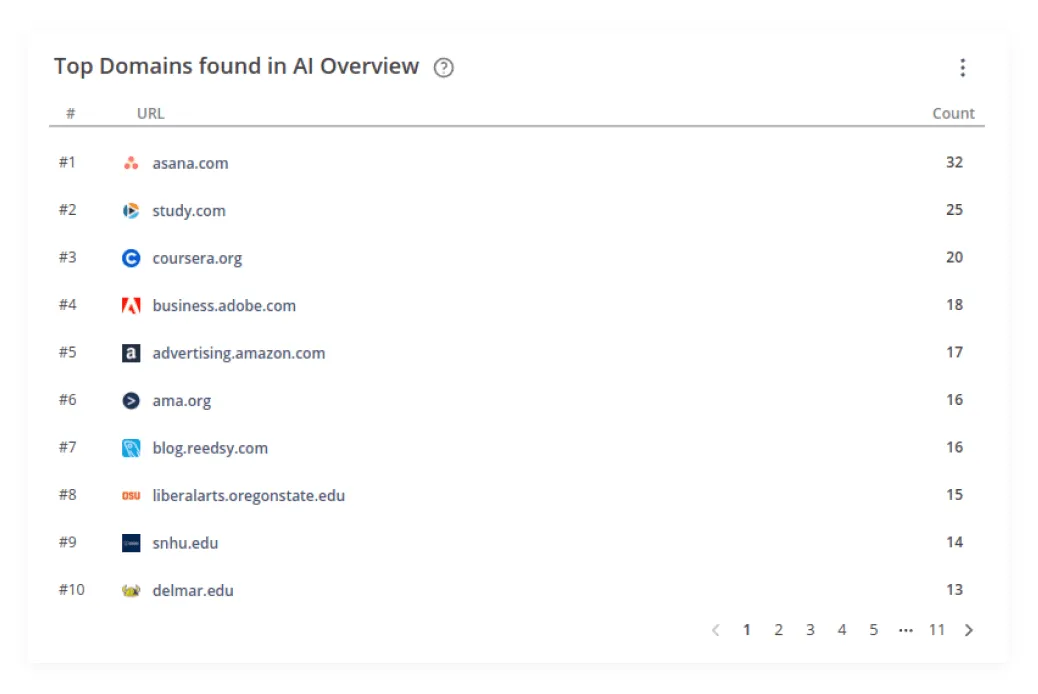
Table for keywords with AI Overview
The table displays all keywords with AI Overview, where the new column "AI Overview" can be used to quickly display the text content of each AI Overview in a very simple format.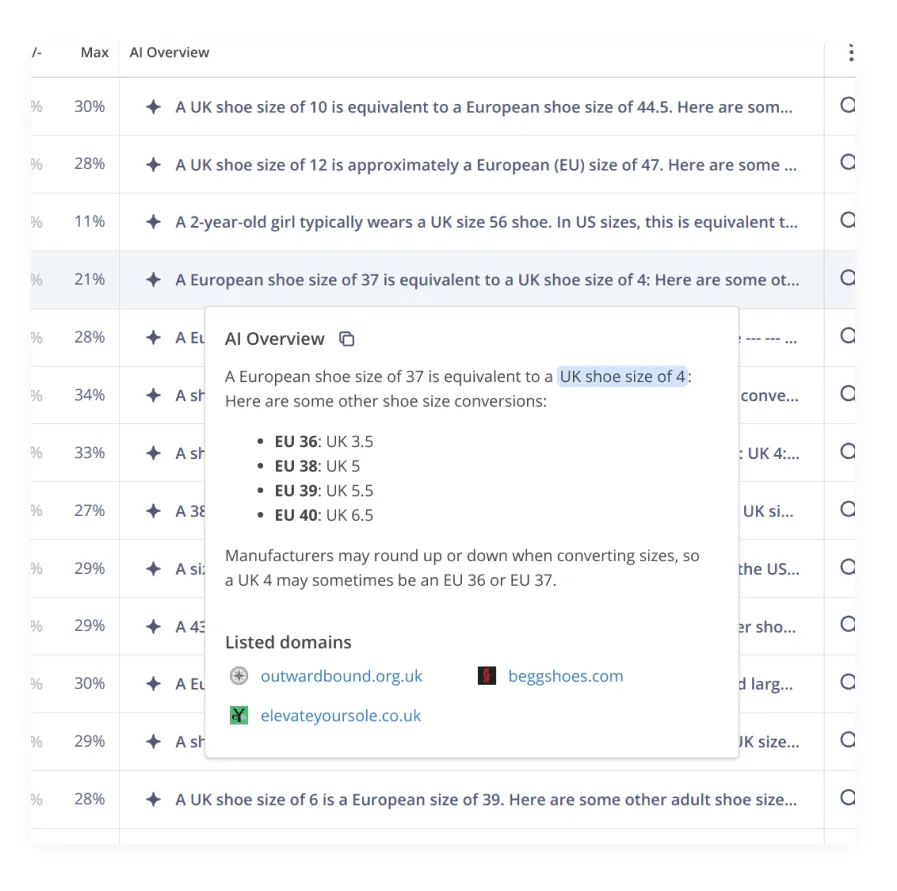
Still need help?
Customer support
Our live support team is ready to assist you with any issues.

